Echarts 相关内容
1、Echarts 图表坐标轴文字太长,省略显示,鼠标放上显示全部(vue)
先上图,看效果
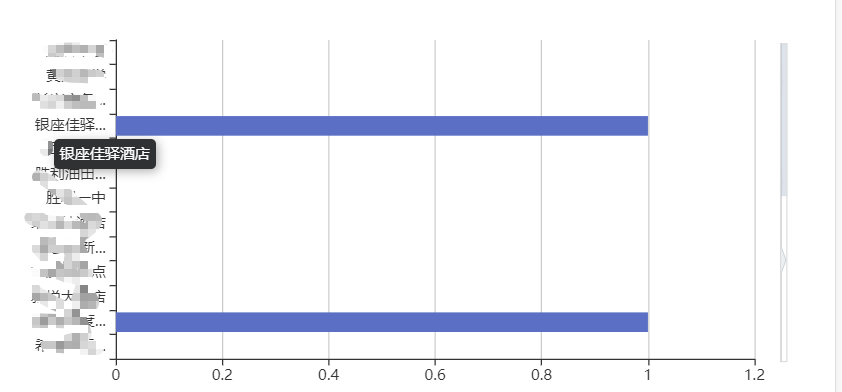
话不多说上代码
<template>
  <el-card class="box-card zone">
    <div
      :class="className"
      :id="id"
      :style="{ height: height }"
      v-loading="loading"
    ></div>
  </el-card>
</template>

<script>
  import { chartMixin } from "@mixin";
  import $ from "jquery";
  import echarts from "echarts";
  export default {
    mixins: [chartMixin],
    props: {
      className: {
        type: String,
        default: "chart",
      },
      id: {
        type: String,
        default: "chart",
      },
      height: {
        type: String,
        default: "400px",
      },
    },
    data() {
      return {
        chart: null,
      };
    },
    beforeDestroy() {
      if (!this.chart) {
        return;
      }
      this.chart.dispose();
      this.chart = null;
    },
    methods: {
      initChart() {
        if (!this.chart)
          this.chart = echarts.init(document.getElementById(this.id));
        const dataZoom = [
          {
            type: "inside",
            realtime: true,
            startValue: 0,
            endValue: 12,
            minValueSpan: 12,
            maxValueSpan: 26,
            yAxisIndex: [0],
            zoomOnMouseWheel: false, // 关闭滚轮缩放
            moveOnMouseWheel: true, // 开启滚轮平移
            moveOnMouseMove: true, // 鼠标移动能触发数据窗口平移
            zoomLock: true,
          },
          {
            type: "slider",
            realtime: true,
            startValue: 0,
            endValue: 6,
            // width: "3.5",
            // height: "80%",
            right: 30,
            width: 6,
            yAxisIndex: [0], // 控制y轴滚动
            orient: "vertical", // 竖直。
            filterMode: "empty", // 当前数据窗口外的数据,被设置为空。即不会影响其他轴的数据范围。
            // fillerColor: "rgba(154, 181, 215, 1)", // 滚动条颜色
            // borderColor: "rgba(17, 100, 210, 0.12)",
            // backgroundColor: "#cfcfcf", //两边未选中的滑动条区域的颜色
            // handleSize: 0, // 两边手柄尺寸
            // showDataShadow: false, //是否显示数据阴影 默认auto
            showDetail: false, // 拖拽时是否展示滚动条两侧的文字
            // top: "1%",
            // right: "5",
            zoomLock: true,
            handleSize: 0,
          },
        ];
        let option = {
          // title: {
          //   text: "",
          // },
          tooltip: {
            trigger: "axis",
            axisPointer: {
              type: "shadow",
            },
          },
          legend: {
            show: false,
          },
          grid: {
            left: "8%",
            right: "8%",
            top: "10%",
            bottom: "4%",
            containLabel: true,
          },
          xAxis: {
            type: "value",
            boundaryGap: [0, 0.01],
          },
          yAxis: {
            triggerEvent: true,
            type: "category",
            axisLabel: {
              show: true, // 是否显示刻度标签,默认显示
              interval: 0, // 坐标轴刻度标签的显示间隔,在类目轴中有效;默认会采用标签不重叠的策略间隔显示标签;可以设置成0强制显示所有标签;如果设置为1,表示『隔一个标签显示一个标签』,如果值为2,表示隔两个标签显示一个标签,以此类推。
              showMaxLabel: false,
              width: 80,
              overflow: "none",
              formatter: function (value) {
                return value.length > 5 ? value.substring(0, 4) + "..." : value;
              },
            },

            data: this.glryfbtj.map((item) => {
              return item.mc;
            }),
          },

          dataZoom: dataZoom,

          series: [
            {
              name: "",
              type: "bar",
              data: this.glryfbtj.map((item) => {
                return item.count;
              }),
              itemStyle: {
                normal: {
                  //这里是颜色
                  color: "#5470c6",
                },
              },
            },
          ],
        };
        this.chart.setOption(option);

        window.addEventListener("resize", () => {
          if (this.chart) {
            this.chart.resize();
          }
        });
        this.extension(this.chart);
      },
      //jquery方式获取dom元素
      extension(chart2) {
        //判断是否创建过div框,如果创建过就不再创建了
        //该div用来盛放文本显示内容的,方便对其悬浮位置进行处理
        var id = document.getElementById("extension");
        if (!id) {
          var div = "<div id = 'extension' sytle=\"display:block\"></div>";
          $("html").append(div);
        }
        chart2.on("mouseover", function (params) {
          //注意这里,我是以Y轴显示内容过长为例,如果是x轴的话,需要改为xAxis
          if (params.componentType == "yAxis") {
            //设置悬浮文本的位置以及样式
            $("#extension")
              .css({
                position: "absolute",
                "z-index": "99999",
                color: "#fff",
                "font-size": "12px",
                padding: "5px",
                display: "inline",
                "border-radius": "4px",
                "background-color": "#303133",
                "box-shadow": "rgba(0, 0, 0, 0.3) 2px 2px 8px",
              })
              .text(params.value);
            $("html").mousemove(function (event) {
              var xx = event.pageX - 10;
              var yy = event.pageY + 15;
              $("#extension").css("top", yy).css("left", xx);
            });
          }
        });
        chart2.on("mouseout", function (params) {
          //注意这里,我是以Y轴显示内容过长为例,如果是x轴的话,需要改为xAxis
          if (params.componentType == "yAxis") {
            $("#extension").css("display", "none");
          }
        });
      },
      //传统方式获取dom元素
      extension(chart) {
        // 注意这里,是以X轴显示内容过长为例,如果是y轴的话,需要把params.componentType == 'xAxis'改为yAxis
        // 判断是否创建过div框,如果创建过就不再创建了
        // 该div用来盛放文本显示内容的,方便对其悬浮位置进行处理
        var elementDiv = document.getElementById("extension");
        if (!elementDiv) {
          var div = document.createElement("div");
          div.setAttribute("id", "extension");
          div.style.display = "block";
          document.querySelector("html").appendChild(div);
        }
        chart.on("mouseover", function (params) {
          if (params.componentType == "yAxis") {
            var elementDiv = document.querySelector("#extension");
            //设置悬浮文本的位置以及样式
            var elementStyle =
              "position: absolute;z-index: 99999;color: #fff;font-size: 12px;padding: 5px;display: inline;border-radius: 4px;background-color: #303133;box-shadow: rgba(0, 0, 0, 0.3) 2px 2px 8px";
            elementDiv.style.cssText = elementStyle;
            elementDiv.innerHTML = params.value;
            document.querySelector("html").onmousemove = function (event) {
              var elementDiv = document.querySelector("#extension");
              var xx = event.pageX - 10;
              var yy = event.pageY + 15;
              console.log("22", xx);
              elementDiv.style.top = yy + "px";
              elementDiv.style.left = xx + "px";
            };
          }
        });
        chart.on("mouseout", function (params) {
          //注意这里,我是以X轴显示内容过长为例,如果是y轴的话,需要改为yAxis
          if (params.componentType == "yAxis") {
            var elementDiv = document.querySelector("#extension");
            elementDiv.style.cssText = "display:none";
          }
        });
      },
    },
  };
</script>
<style scoped></style>